Do current approaches to accountability help trustees, governors and school leaders?
I recently heard a maths teacher talking about “value for time”. This struck me as a really useful way to think about the things we ask teachers to do.
One of those big time bandits in schools is the setting, assessing and monitoring of internal, teacher-marked assessments which are used to work out whether individual pupils and groups of pupils are on or above target to make “expected progress”, and by implication, whether they have been taught well enough.
Trustees and governors use these as a proxy for school quality, and to try and get advanced notice on how well the school is likely to perform in external published exams in the summer.
We know that external accountability is important for schools. Publicly published external data can affect pupil recruitment, which in turn affects finances. Many schools are well aware that the systems they use have big workload and time implications, but judge this to be something where the benefits outweigh the costs – they see it as having value-for-time.
Researcher and teacher Ben White quotes a headteacher, explaining exactly why: “If you’re going to face some fairly stark summative judgements about how you’re performing as a school, you know, it’s no good being in the dark for two years and then finding out how well, or otherwise, your examination groups have done. You need to be on it, you know, right the way through the two years. So I think it’s just a chain of accountability.” (White, 2017)
However, Professor Becky Allen has pointed out regularly (May 2018, November 2018, April 2019) that summative in-school assessment data are unlikely to be able to do many of the things we want them to do, like accurately monitor progress, tell us what a pupil needs to learn next, or tell us something meaningful about the quality of teaching.
As Daisy Christodoulou says (2018), assessment is all about inference. When we ask schools for data, what we really care about is what that data can tell us. How well is the school performing? Is there more that can be done to support pupils to achieve better? Is teaching and learning good enough? Is leadership good enough? But what if the data we are asking for is not helping us get to the nub of these issues, but is actually a hindrance?
One of our aims might be to predict how pupils are likely to perform at the end of the academic year, to get ahead of any nasty surprises and put support in place where needed. However, as Ben White has demonstrated, it is unlikely that summative data has the sort of predictive power that we would like it to have (White, 2017).
In the chart below – taken from a 2015 Education Datalab report (p11) – we see that past performance does not predict future performance as exactly as we would like it to.
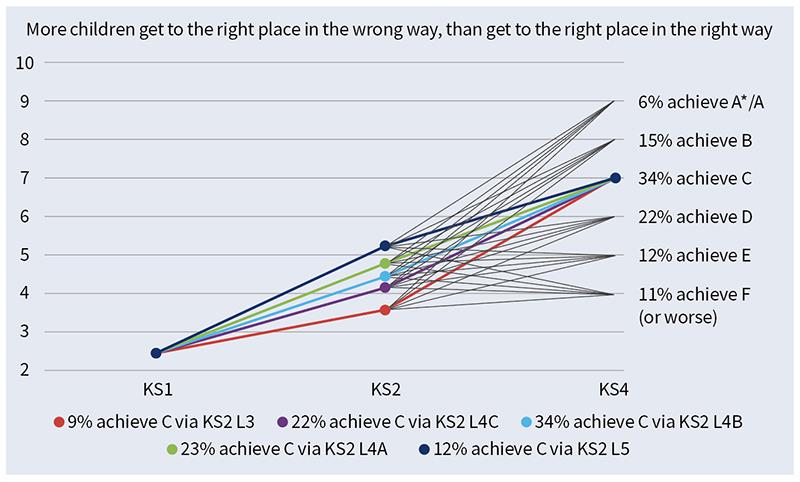
Crystal balls? Past performance is not always a reliable predictor of future performance (Chart: Education Datalab, 2015)
We also want to use data to tell us how effective teaching is. But how precise and accurate are internal assessments? A boxplot from a meta-analysis in Ofqual’s 2016 Marking consistency metrics report (see p25 of the report, figure 14) shows us how often external examiners awarded the same grade as teachers.
In French we are looking at around 85 to 90 per cent of the time. However, in English literature – because of Daisy Christodoulou’s adverb problem – (see Christodoulou, 2013), it is barely 50 per cent. And that is at grade level – remember that in many schools teachers are puzzling over whether a pupil is on sub-grade 6c or 6b! Given these problems, I do not think this approach to monitoring is worth the time teachers have to spend on it.
Given the well documented recruitment and retention issues, especially at secondary level and among early career teachers (NFER, 2018), we need to think about the workload implications of our systems.
What can we do?
Tom Rees, director of school leadership at Ambition Institute (where I now work as learning design manager), has noted that “often, teachers and school leaders are quick to blame Ofsted and the government for things that are wrong with accountability. In fact, lots (most?) of the damaging processes and approaches are within a school’s gift to change for the better. Schools can do more to rethink their approaches to monitoring, staff development and evaluation” (Rees, 2018). The message here is clear – in a school-led system, the power to change things is on our hands.
Rethink dashboards
One thing that I have asked for as a governor and trustee are dashboards that focus on more qualitative information: how do leaders feel about the robustness and rigour of the curriculum for pupils? To what extent is teaching where they want it to be (this is not about individually “graded” lessons), and to what extent is behaviour around school where they want it to be? Finally, are they happy with the development pathways for staff?
Putting this together does not require gathering lots of data from teachers – it just requires leaders to make a judgement. It will not be precise, but that is okay. It helps to start a conversation.
Leaders and trustees can work together on crafting a set of descriptions of what teaching, staff development and curriculum look like when they are exemplary or unfit for purpose.
If an atrocious curriculum is 0 and a perfect one is 5, how would you describe 1 to 4 in a couple of paragraphs? This can become a key for leaders to use when constructing a dashboard that includes qualitative judgements and can fulfil the governance role of crafting a clear vision for the school.
Embrace (and manage) ambiguity
We need to become comfortable with some margin of error or ambiguity. This is hard, because as Clare Sealy (2018) says, “flightpaths, graphs and charts (offer) the illusion of certainty, of rigour”. Making a conscious decision to abandon what seems rigorous for fuzzier measures takes bravery.
But I think it is worth doing: as Ms Sealy says: “This is fake rigour, delusional certainty, but oh so deliciously tempting! Who wouldn’t want the sweet taste of certainty, of ‘sciency’ looking graphs, rather than unpalatable messy reality?”
It would be unfair to rake a principal over the coals because they were predicting a one-point drop in Attainment 8, if the average margin of error in Attainment 8 predictions in that school has been three or four points – for all we know, the school might actually be on track for a slight improvement! If we do decide to retain some data drops, we should treat their outputs as a fuzzy measurement that helps start conversations, and not as the unalloyed truth.
We also need to know what actually sits behind the numbers. We might be getting exercised by static key stage 4 outcomes when there is an awful lot happening to improve the curriculum and teaching in key stage 3 – it will not show up on external data for years, but it is still essential work.
On the other hand, we might be patting ourselves on the back for improvements in key stage 4 outcomes when these are based on intensive intervention in year 11 and key stage 3 receives less attention than they should.
Use raw data
Clare Sealy uses the term “raw data” in contrast with the “highly processed data” traditionally preferred by “governors and that host of others who would hold us accountable” (2018). She advises us to pay more attention to the raw information.
She writes: “For example, a times table quiz, a check of which sounds a child knows, a multiple-choice quiz from a recent history topic, an analysis of a ‘cold write’ for a small number of highly specific grammatical features, a fitness ‘bleep’ test, a test of reading fluency – these kind of assessments are ‘granular’; they check how much a child has learnt about a small, specific component of whatever they are learning: the fine ‘grain’ of learning. Such assessments might be reported as a simple test score or percentage.”
It is important to note that while these approaches give us information which is more “real”, the data these approaches generate will not allow governors and leaders to benchmark against others, or to make predictions or inferences about how pupils might perform in external exams.
But we should always be asking leaders to focus on improving teaching and developing teacher expertise. Being confident that leaders are doing the right things to improve teaching is more important than being confident that an Attainment 8 prediction for the summer is correct within one percentage point – if the teaching is right, attainment will follow.
Final reflections
It would be misleading for me to claim that, based on years of teaching and governance experience, these strategies are proven to transform workload for teachers and help them to focus their time and efforts on more useful things They are not.
However, personally, I think this approach is the best bet. I feel comfortable with “managed ambiguity” as a chair and a trustee. Also, I remember being a secondary school English teacher, and the sole English teacher for more than 150 pupils each year, during the days of fortnightly(!) hour-long assessments generating a couple of pages of work per pupil. That is 300 pages a fortnight to close-mark for spelling, punctuation and grammar, alongside a sub-GCSE grade (C-, C=, C+ anyone?) chosen from an adverb-based rubric, and a comment for the pupil written in rubric-speak. I do not want to think about what else I could have done with those hundreds of hours.
Finally, although this is not the core intent of asking schools to think about data in a different way, there is value in signalling that as a trust or governing board, what we are really interested in is finding out what is actually happening in the school – where leaders think that current approaches to teaching, curriculum design, behaviour, attendance, etc, are working well and where they need to be tweaked.
Fundamentally, this information can help leaders and teachers to keep getting better. By striving to get to the nub of these issues, rather than being happy with multi-coloured dashboards that might obscure more than they illuminate, we are doing our jobs better and serving children better.SecEd
- Chris Read is chair of trustees at Essa Academy Foundation Trust, a trustee at Consilium Academies, and a manager in the learning design team at Ambition Institute – a graduate school for teachers, school leaders and system leaders, serving children from disadvantaged backgrounds. Visit www.ambition.org.uk
Further information & resources
- Why does data use punch above its weight when it comes to workload? (and what can we do about it?), Walden Education (Ben White), November 2017: http://bit.ly/2JKEj5G
- Meaningless data is meaningless, Becky Allen, November 2018: http://bit.ly/2Q7Ur2d
- What if we cannot measure pupil progress? Becky Allen, May 2018: http://bit.ly/2HoHXR0
- Writing the rules of the grading game (part I): The grade changes the child, Becky Allen, April 2019: http://bit.ly/2VvvFdp
- Assessment: Why it matters and what you need to know, Daisy Christodoulou, Impact, Chartered College of Teaching, June 2018: http://bit.ly/2HomI1S
- Seven things you might not know about our schools, Education Datalab, March 2015: http://bit.ly/2pyrDXk
- Marking consistency metrics, Ofqual, November 2016: http://bit.ly/2JpSkpR
- The adverb problem, Daisy Christodoulou, November 2013: http://bit.ly/2LPkQn1
- Latest teacher retention statistics paint a bleak picture for teacher supply in England, Jack Worth, NFER, June 2018: http://bit.ly/2JKG1nC
- Rethinking Accountability: Part 1, Tom Rees, August 2018: http://bit.ly/2LQvbzb
- Eat your data raw! Clare Sealy, primarytimerydotcom, December 2018: http://bit.ly/2HoJFlo